11.27.2013

Google Earth for ya Head

Brain iz confusing place.
ichcb, via flickr


My friend Katherine called my attention to this fun little exercise: the brain represented as a subway map, as imagined by artist Miguel Andres and picked up by Know More, an offshoot of the Washington Post's much-loved Wonkblog. Unfortunately, I told her, I have to disavow it completely. (Sorry if you just spent 5 minutes memorizing it.) It's a darn cool idea, but it's not a teaching tool.


I'd say (somewhat generously) that it's about 30% right on anatomy, 20% on functional localization, and -- most damningly -- less than 10% right on how the brain actually works. It's more misleading than informative.

I don't know whether Andres ever hoped it would be used at a place like Wonkblog; it could have been just a creative work, by which standard it's cool enough. But since it was, and now it's going around the web, I'll try to 'splain what it does wrong.


Anatomically, it's a crapshoot. For one thing, it seems to say that analogous systems on opposite sides of the head are doing totally different things. This isn't true. Now granted, while the old "left brain vs right brain person" thing is deeply exaggerated, it's true that the two halves of the brain do subtly different, but coordinated, things. However, those processes are usually complimentary -- for instance, the area on the left that does language production, called Broca's area (hence the reference on the map), has an analog on the right that does pitch inflection, and other "non-verbal" communication stuff.

But then half the time, this map's routes are just totally unrelated to how the brain is actually set up. Not only don't your eyes go straight to different functions, input from your eyes goes ALL THE WAY TO THE BACK OF THE BRAIN, with a stop or two in the middle, to do visual processing. The image we reconstruct is then passed forward into the brain to do things like physical spatial awareness, object recognition, etc., and then further forward still to do things like emotional associations, decision-making, etc.

Where this map will get you.
Peter Ward, via geograph

The biggest problem is that looking for a particular instantiation of something, like "aggression," isn't gonna get you anywhere. You want to look at "mood," or "social cognition"? Well we're still arguing about it, but at least we believe there are areas within networks that might underlie stuff like that. Pointing at a brain region and saying "aggression" is like looking at a computer motherboard, pointing at an area and going, "PDF." It's like what, no.

Also, doing a 2D brain anatomy lesson is hella hard, cuz... it's not a 2D organ. Imagine doing a subway map, only instead of stops being at intersections, they're at offices. ("The next stop is: Lexington and 53rd. And the 26th floor.") Not the easiest thing to stick on a poster or a t-shirt.


Disappointingly, scientists are often pretty bad at this kind of thing, surprise. Arguably the best free, lay-centered thing you can get on neuro right now is the Brain Facts book published by the Society for Neuroscience (SfN), a professional organization. But it's not exactly "multimedia," and BrainFacts.org in general is a great idea, but it doesn't seem to be a lot of centralized learning resources so much as a feed of relevant articles.

This little feature, on the other hand, is kind of fun and to the point -- but it's talking about the project neuro researchers are currently tackling, not delivering the latest approximation of their results in an intelligible or interesting way. And it also brings up kind of an interesting analogy -- Google Earth.

Google Earth is an official product, obviously, but the dorkier among us remember when it had alpha and beta stages, and a lot of that was available to the public. They release funky little plugins now and again, like last year when they made an ancient Rome map you could overlay over the modern-day area. And when we look at 3D Manhattan and the buildings are wonky and the textures don't load, we're slightly peeved but much more amused. We want to play. And play we did, to the point where Google collected a lot of feedback by farming their testing out to interested people.

Making something similar for the brain would be a great outcome for neuro in the next decade; it's just harder because a) scientists are more afraid of being wrong than app developers, and b) people know what Manhattan looks like without Google Earth. We can't really say the same for, you know, the left inferior parietal lobule. Plus, a road is pretty easy to interpret; the brain's function is way less obvious a consequence of its structure.

...

HOWEVER! A Google search revealed that we do kind of have something like this now! Much excite! It's called the BigBrain, and it was rolled out in June of this year thanks to folks at Research Centre Jülich and Heinrich Heine University Düsseldorf in Germany, and the esteemed Montreal Neurological Institute at McGill University in Montreal. I'm going to be playing with it a lot. As for the functional part -- you know, getting off the brain train at "social cognition," etc. -- we've got a ways to go. Thanks in part to the BRAIN Initiative, however, which I'll discuss in another post soon, we might be just years away.

My only reservation is that a physical reconstruction, while hugely important and useful, isn't that interpretable a map (especially to non-neurogeeks). Cartographers, demographers, etc. are huge, lucky nerds because they get to fiddle around with how to present geographic information in the most novel and informative ways; to them, Diffusion Tensor Tractography is a map they'd want to delve into, whereas the BigBrain is more like satellite images of a mountain range -- nothing's highlighted for you. However, I'd bet the tractographic equivalent is right around the corner.

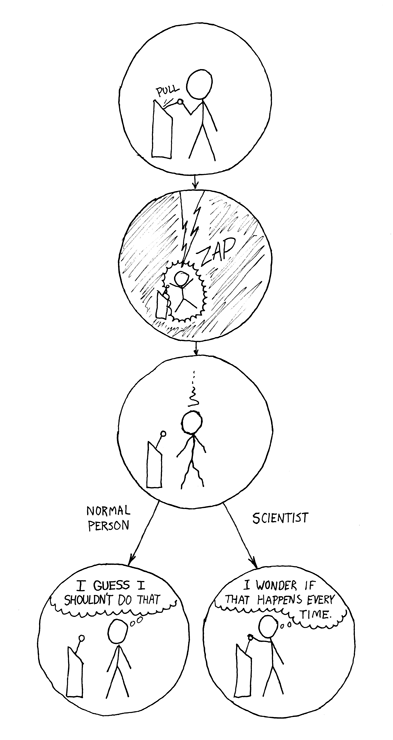
Now THAT'S worth taking for a spin, amirite?
AFiller via wikimedia
Anyway. I'm pumped for the neuro community to come together over the next few years and democratize this knowledge, even if, as the subway demonstrated, it won't always be easy. But hey, everybody should be able to have the same fun we do -- taking a hike in unexplored terrain, and getting wonderfully, confoundingly lost.

11.12.2013

Significance is... Significant. But Also, Not Everything.

A post in which I write about statistics for non-scientists, and then stick it to the man. Gently.

Fun things you'll learn to impress friends at parties:

  • statistical power
  • effect size
  • my true place in the academic food chain
  • that you kno nuthin, Jon Snuuuu

The Incubator, a science blog at the Rockefeller University in New York, just posted a link to this paper by aggie Valen Johnson about the somewhat foggy standards for statistical significance in science. PSA: you should check out the Incubator, it's great; and my friend and former classmate Gabrielle Rabinowitz writes and edits for it!


Another XCKD, because look at it.
Personally, I think that if we only taught one science/math class to all Americans (though heaven forbid), it would have to be statistics. Since stats is the study of things we are too dumb, too big, too small, too slow, etc. to do perfectly -- e.g. make accurate predictions, snag individual molecules, measure the economy, or anticipate a dice roll -- it is one of the most powerful and simple ways of becoming smarter than one person's worth of day-to-day experiences can make you. Simply put, most people can't gather enough accurate data to reliably know what's happening outside the bubble of what they can see, hear, and touch.

An even more important lesson stats teaches is that everything we "know" is really only known with some degree of certainty. We may not know what that degree is exactly, but we can still get a sense of how likely we are to be wrong by comparison: for example, I am much more confident that I know my own name than that my bus will show up on time. However, as a lifetime's worth of twist endings to movies can tell us, there's still a teeny-tiny chance that my birth certificate was forged, or I was kidnapped at birth, or whatever. Years of hiccup-free experience as myself provide a lot of really good evidence to believe it's true, and if my family and I were to get genetic tests, that would make me even more confident -- say, I'd go from 99.99999% sure to 99.9999999999%. May seem arbitrary, but that's still a million times more confident. And even though I don't feel that way about my bus I'm yet more confident that the bus will show up on time than that most political pundits can predict the next presidential election better than a coin toss. (Come back, Nate Silver.)

When scientists conduct significance tests, we're basically doing the same thing -- we want to know the truth, but instead of saying "when this happens, that other thing happens," we want to say, "this reliably precedes that," and if possible, "this reliably causes that." The last one is a lot harder, but as for what constitutes "reliable," or "meaningful," the word we use is significant and by convention we say an effect is significant when it would only happen one out of twenty times if it was just by chance.

Now, you don't have to be a scientist to see both the pros and cons in this strategy. Obviously, one such experiment on its own doesn't so much prove anything as make a statement about how confident we are in our conclusions. The lower the odds of something happening just by chance, the more we feel like we know what we're talking about. For example, rather than use the 1 in 20 cutoff, physicists working on the Higgs Boson had enough data to use a benchmark closer to my confidence in my own name. And in recent months and years, the science community, especially in the life and social sciences, has become more and more suspicious that our confidence is too high -- or put another way, that things we say could only happen by chance one in twenty times could actually happen a lot more often. That maybe the things we think are real, are sometimes wrong.

Scary, innit?

Well, it seems reasonable, then, to do what that paper is proposing and move the goal-posts farther away, so only stuff we're reeeeeaaaally confident in will pass for scientific knowledge. But there are big hurdles to this -- some practical, some theoretical. First of all, just like we can calculate how likely something is to happen by chance, we can calculate how likely we are to see how unusual such an event would be. If buses can all be late sometimes, and vary in how much, how many buses would I have to take to say that the 28 line is more likely to be late than the 80, and I didn't just take the 28 on a rough week -- even if I'm right? (Right now, all I have is a feeling, but just you wait.) The odds that I'll be able to detect a significant difference where such a difference exists is called statistical power. And it's one of scientists' oldest adversaries.

See, most science labs are pretty small, consisting of a handful to a few dozen dedicated, variously accomplished nerds, under the command of one or two older, highly decorated nerds. (Grad students are whippersnapper nerds who have only demonstrated we have potential, though collectively we do a lot of the legwork.) Most labs don't have all that much money, depending on the equipment we have to use, and we don't have that much time before we're expected by the folks who control the money to publish our results somewhere. It's not a perfect system -- that critique is for another time -- but it works okay. Yet with the exception of really big operations like the public is often familiar with, projects like the Large Hadron Collider and the Human Genome Project, or labs whose subject matter lends itself to really high 'subject' counts like cell counts or census data, it's really hard to get enough rats, patients, elections or what-have-you to guarantee you'll detect any tiny difference that is really there. A lot of fields, including and especially neuroscience, are slaving away the months and years in lab on experiments where, even if they're right, the odds are they won't be able to tell.

So the idea of moving those goalposts way out there, while in many ways very necessary, also necessitates a huge shift in the way science is funded and organized. Studies would need to be much larger, there would be fewer of them (which would restrict individual labs' ability to explore new directions or foster competing views), and money would tend to be pooled in really big spots. We know -- exactly because of successes like LHC and HGP -- that this can work, and indeed might be the only way to ensure that certain parts of the controversialif dialed-down, BRAIN initiative by the White House will yield anything concrete. There's no question, though, that some disciplines would be hit harder than others with such a change.

But that pales in comparison to questions about the role p-values, which are those odds that it happened by chance, should play in how science is published and reported. They may be the gold standard to which science has aspired for the better part of a century, but I think they can only really paint a complete picture with some help.


***


Last year I had the privilege of working on a project with classmates at the La Follette School of Public Affairs, part of UW-Madison, that tried to estimate how much value would be generated by a non-profit's efforts to provide uninsured kids with professional mental health services, right there in their schools. In order to estimate that, we needed to know not just whether counseling helped kids, but how much it helped. So in looking through the literature on different kinds of mental health interventions and how well they treated different mental illnesses, we often focused on effect size, which is a measure of how big a difference is. It sounds related to significance, and it is, but here's where they diverge. Let's say that we want to know whether Iowans are taller than Nebraskans. We go and take measurements of thousands of people in both states, giving us really good power, so if there's a difference we'll probably see it. We find that a difference exists, say that Iowans are really taller. We also know that based on our samples, the odds are less than one in a thousand that we just happened to pick some unusually tall Iowans. Great job, team!

But... what if Iowans are, on average, less than a quarter-inch taller? Even if we're right, who cares?

That's what we wanted to know for our research -- if these kids see counselors regularly enough for therapy to work, how much better will they get? Once we'd read the work of countless other researchers, we had a pretty good idea, and we used that in our calculations. (As a side note, we found that the program probably saves the community about $7 million over the kids' lives for every $200,0000-costing year it runs -- in other words, it's almost definitely a good call.)

But effect size isn't what makes your work important. In most cases I've seen, it's not even reported as an actual number. In fact, as a graduate student with several statistics courses under my belt, I never formally learned how to do it for class. I figured it out, and applied it to datasets and published results, for the first time for that project.


What different effect sizes look like.
via Wikipedia.
For those who are wondering, briefly: effect size (at least, as expressed by Cohen's d) is how big the difference is, expressed in standard deviations in the variable's distribution. In other words, if people in Iowa are 5'11 plus or minus four inches, and people in Nebraska are 5'10 and 3/4, the effect size is 1/4 inch divided by four inches = 1/16, or .0625. In contrast, the effects of therapy on mental illness are on the order of 0.5 - 1, or about ten times larger relative to the underlying average.

Significance is what makes differences believable; effect size is what makes them meaningful. And power, the other number I think should be estimated and reported, shows how well-prepared a study was to find a real effect -- which, especially for studies that fail to confirm their hypotheses, would provide a measure of rigor and value to their publication. While science has, correctly, always strived to prove its best guesses wrong before declaring them right, it's about time we got a sense of whether the status quo is right either, and whether either answer matters.

However the scientific establishment, despite much wailing and gnashing of teeth, is, like any large institution, having a hard time moving forward with such sweeping normative changes. It's taken Nobel Laureates, brilliant doctor-statisticians with axes to grind, and dramatic exposés of mistaken theories and sketchy journals to make our systems of measurement a real issue in the science community. I feel strongly about this, but I'm just a grad student: a foot-soldier of science training to become an accredited officer. So I'm glad people, like the author of the article that kicked off this post, are continuing to publish seriously about it and propose real changes in the community's expectations.


I'm just here to say, I think most of the changes on the table are only part of the picture, and wouldn't succeed on their own. We need standards for reporting effect-size and power, so we can see for ourselves what the truth really looks like.